

Overview
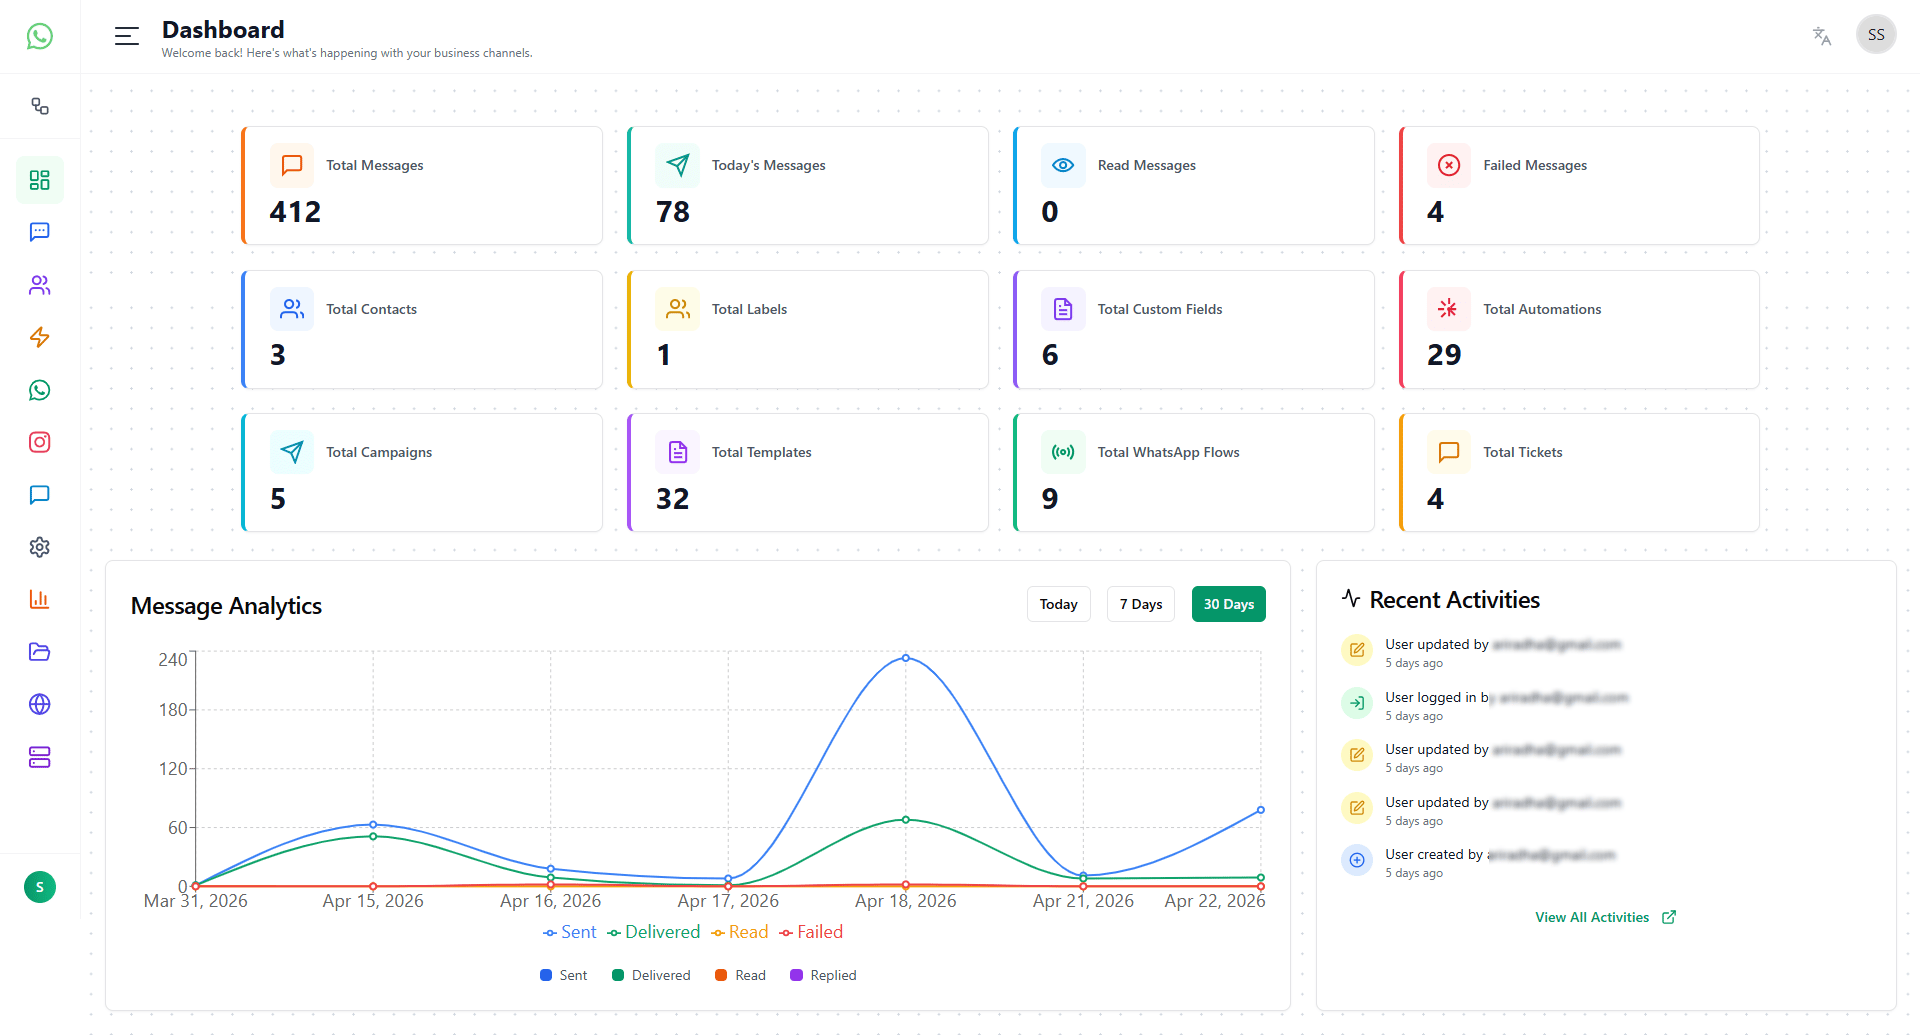
The page is structured into three main sections:- Metric Cards (Top Summary)
- Message Analytics
- Recent Activities
Metric Cards
The top section displays a grid of summary cards. Each card represents a key metric.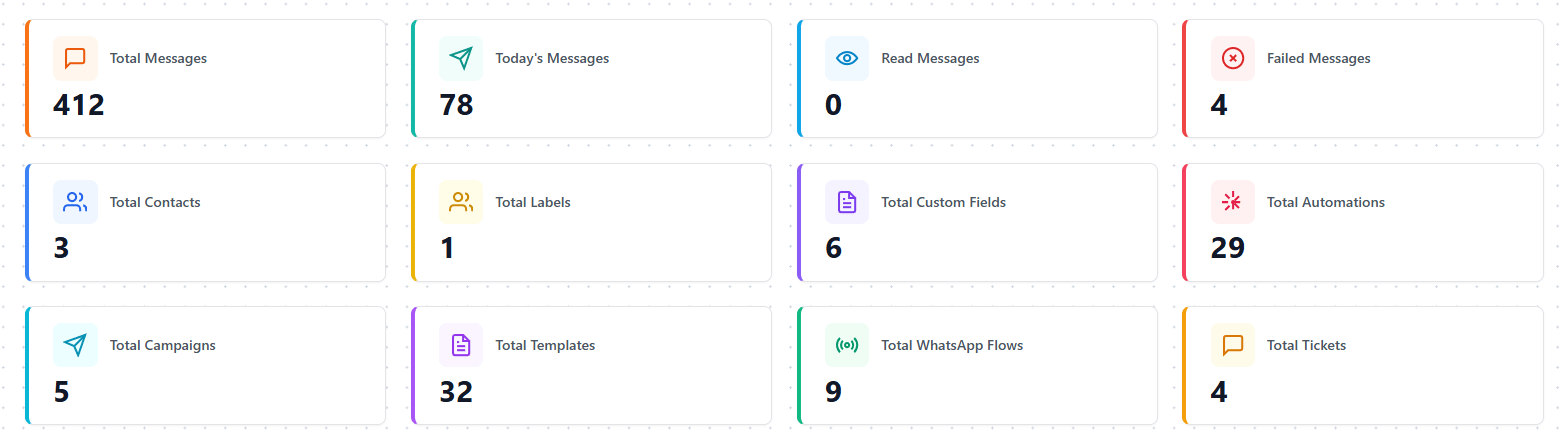
Available Metrics
These metrics provide a quick snapshot of system usage and performance.
Message Analytics
This section shows message trends over time using a line chart.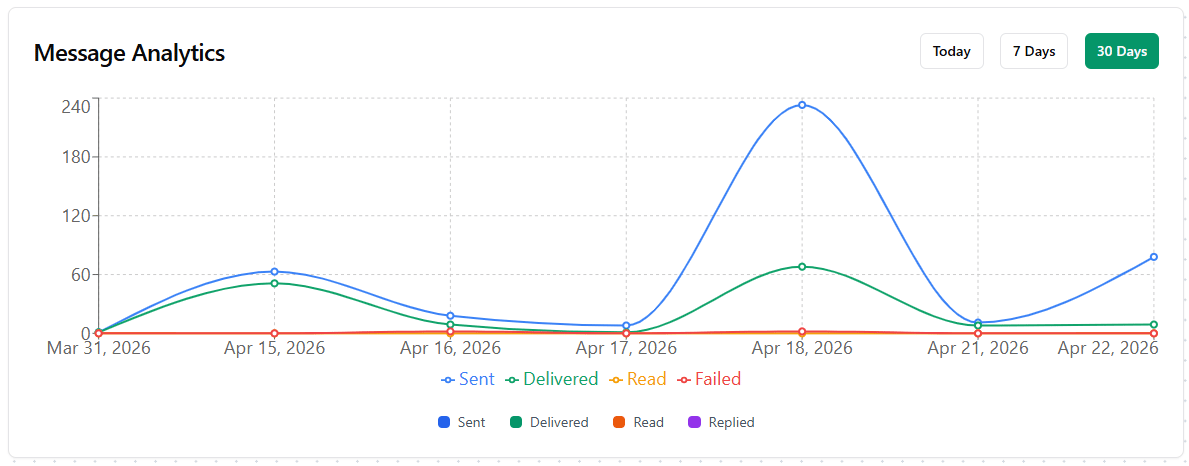
Features
- Visual trend of message activity
- Tracks:
- Sent messages
- Read messages
- Failed messages
- Time range filters:
- Today
- 7 Days
- 30 Days
Usage
Use this section to:- Identify peak messaging periods
- Monitor delivery performance
- Track engagement trends
Recent Activities
Displays a timeline of the latest actions performed in the workspace.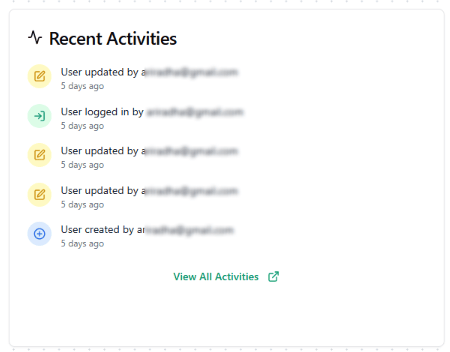
Includes
- User actions (login, updates, creation)
- System events
- Timestamp for each activity
Behavior Notes
- All metrics are dynamically updated based on the active workspace or channel.
- Data refreshes automatically based on system activity.
- Analytics reflect historical trends based on selected filters.
Summary
The Dashboard acts as a central monitoring layer, allowing users to:- Track messaging performance
- Monitor system usage
- Review recent activity
- Quickly assess overall platform health